Description:
PDF reports include a summary page which can be toggled on or off. If on, the summary page will be shown after the cover page. The summary page can include 3 things:
- Summary text - see Add summary text to reports
- Graphs
- List sign off information - see Sign off or archive a list.
There are three graphs that are automatically created when a report is generated:
- A doughnut graph of all items
- A bar chart of items by locations - shows up to the top 5 locations
- A bar chart of items by assignee - shows up to the top 15 assignees
When generating a new report you can choose whether you want to show the summary page or hide it completely. If shown, you can also decide whether you want to include the graphs or just the summary text and sign off information.
Notes:
- If you hide the graphs and there is no summary text or sign off information provided then the summary page will not show.
- By default, the summary page & graphs will be shown on your reports. If you wish to change this default you can utilise the Display PDF summary page and Display PDF graphs report settings. See Report settings: Update default summary page & graph settings.
Contents:
This article covers two modifications that you can make to the summary page
Guide:
1. To show or hide the summary page
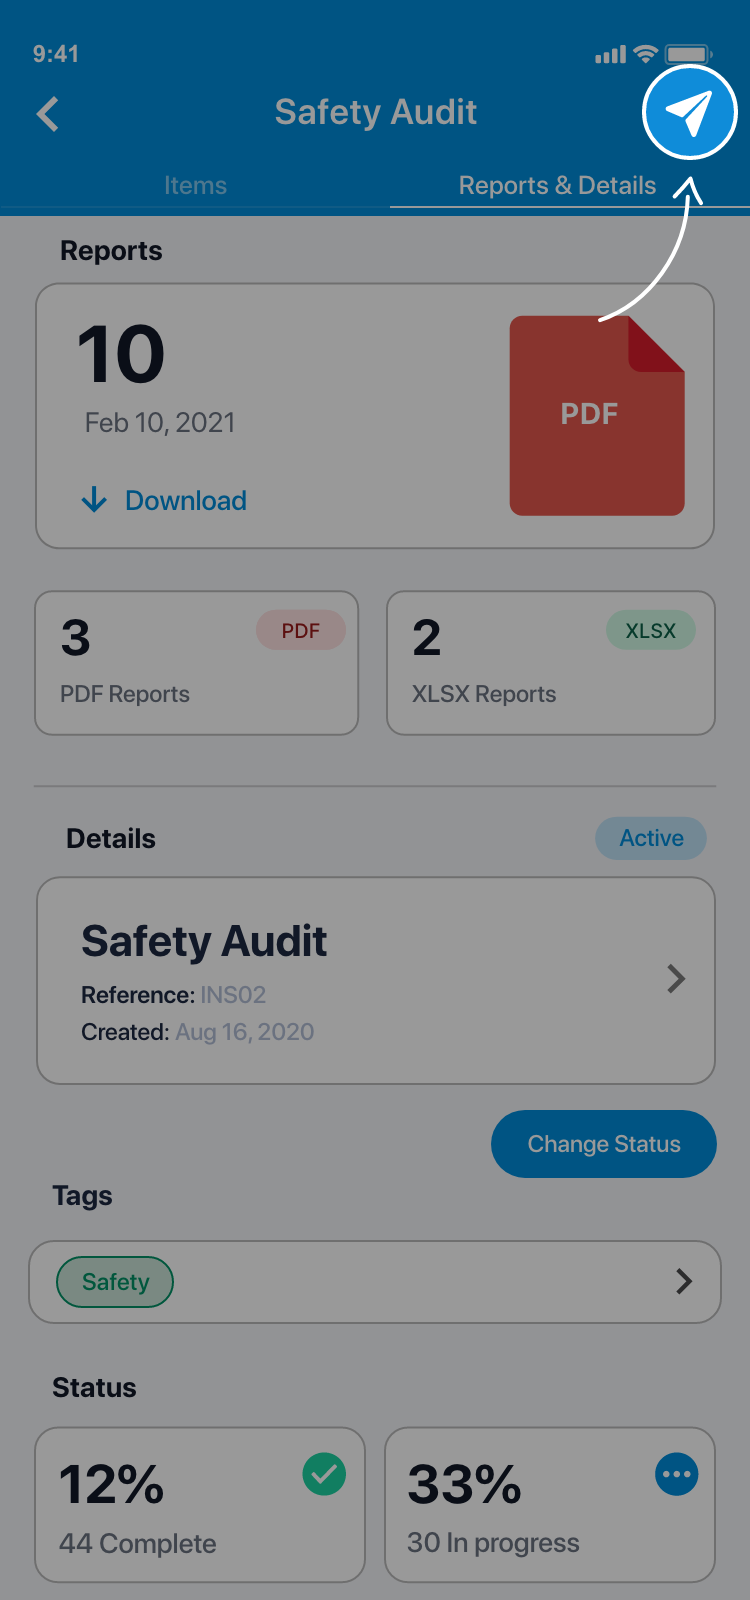
1.1. Start generating a report - see Create a report.
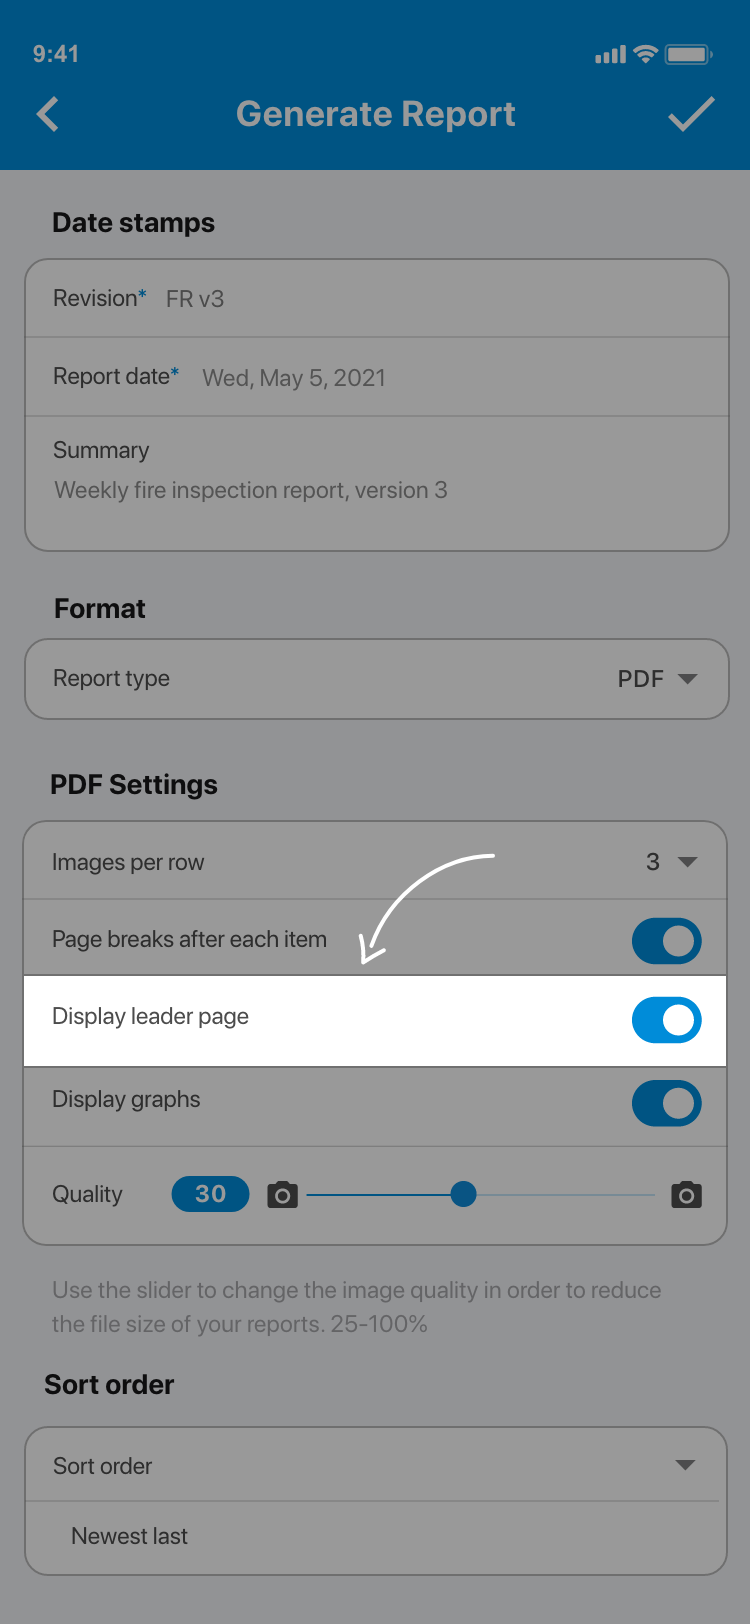
1.2. Before you tap the ✓ to generate the report, scroll down to the PDF Settings heading. You can now tap on the switch next to the Display summary page option to choose whether or not to include the summary page on the report. If the switch is blue the summary page will be included. If the switch is grey it will not be.
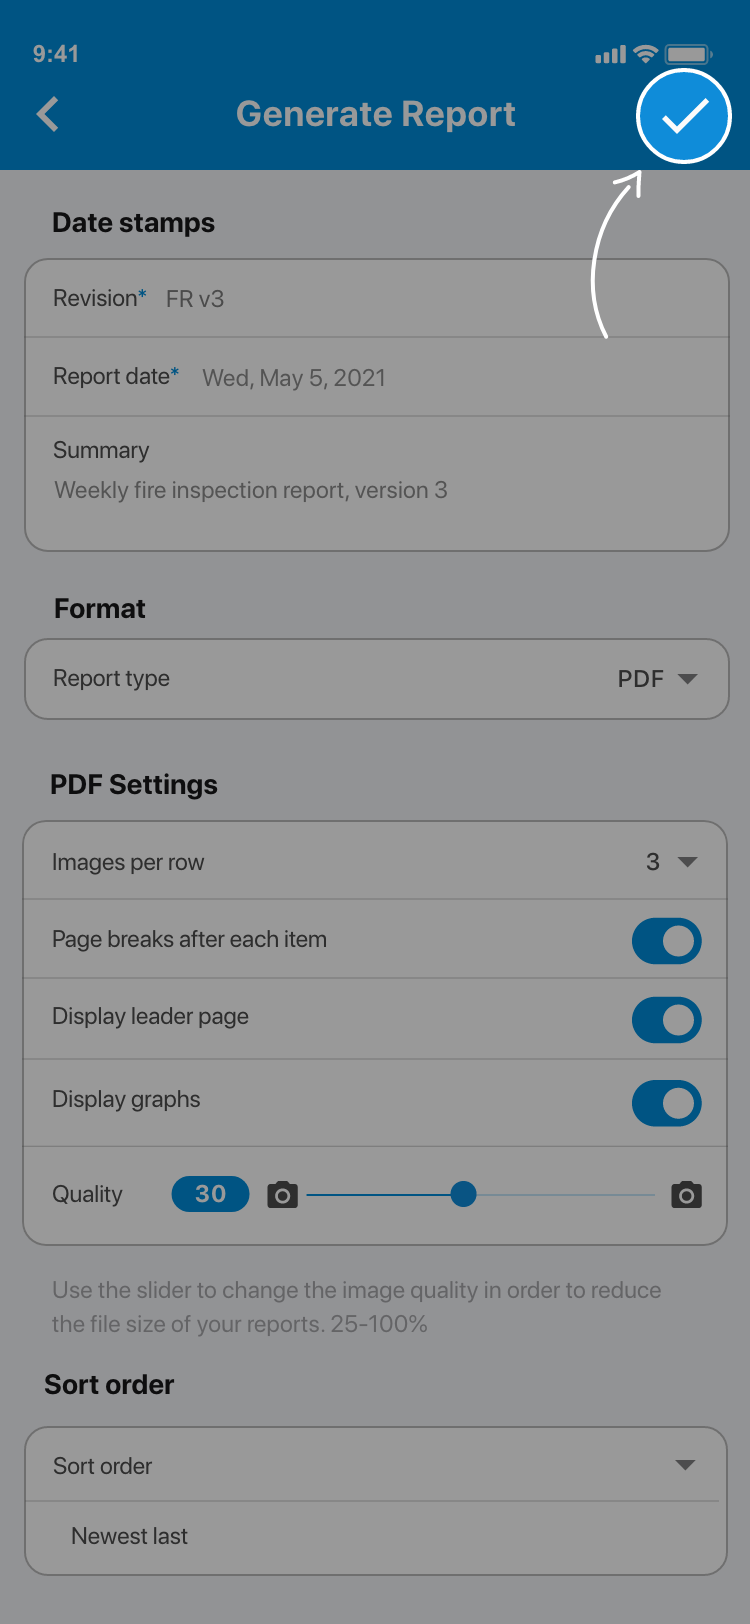
1.3. Tap the ✓ in the top right of your screen when you are done. Your report will be generated and will now be available under the reports tab.
2. To show or hide the graphs
2.1. Start generating a report - see Create a report.
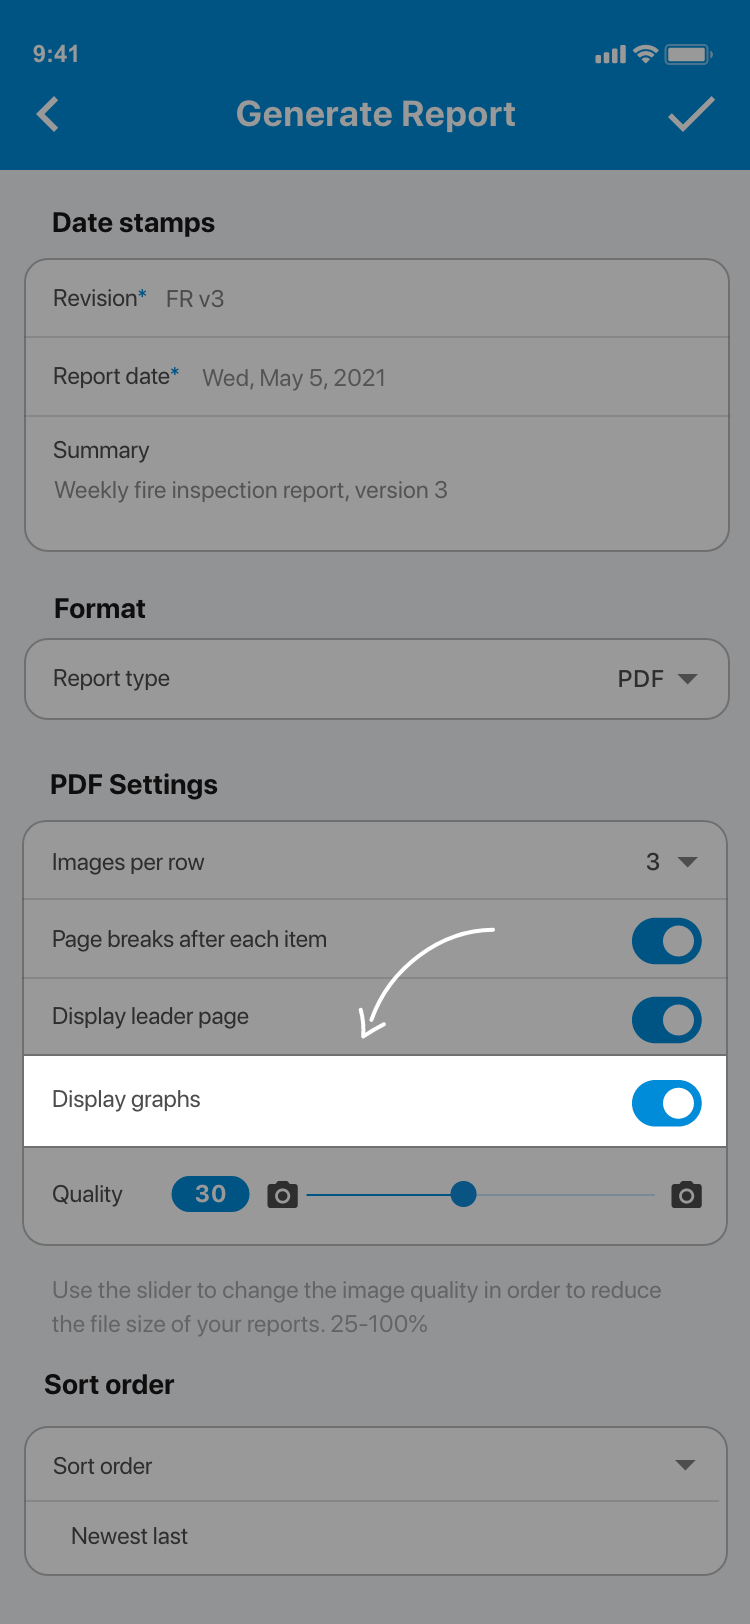
2.2. Before you tap the ✓ to generate the report, scroll down to the PDF Settings heading. You can now tap on the switch next to the Display graphs option to choose whether or not to include the graphs on the summary page. If the switch is blue the summary page will be included. If the switch is grey it will not be. Note: if the Display summary page option is set to off, the Display graphs option will not show.
2.3. Tap the ✓ in the top right of your screen when you are done. Your report will be generated and will now be available under the reports tab.
Comments
0 comments
Please sign in to leave a comment.